Das arktische Meereis taucht immer wieder in den Nachrichten auf, insbesondere wenn es mal wieder geschrumpft ist. Wer sich selber einen Überblick über die Entwicklung des arktischen Meereises verschaffen will, kann dies in diesem Online-Tool des NSIDC machen. David Middleton hat auf WUWT eine gute nichtalarmistische Einführung zum Thema Meereis geschrieben. Darin geht er auf grundsätzliche Fragen ein, wie die Meereisbedeckung überhaupt gemessen wird und was „eisfrei“ eigentlich genau bedeutet. Außerdem setzt Middleton die aktuelle Entwicklung in den Kontext der letzten Jahrtausende.
Interessant ist auch eine Arbeit von Bunzel et al. 2018, in der Probleme bei der satellitengestützten Bestimmung der Meereisbedeckung aufgrund von Problemen mit der Schneehöhe diskutiert werden.
Ron Clutz wies auf Science Matters darauf hin, dass das September-Meereis-Minimum seit 2007 ziemlich konstant ist:
Over this decade, the Arctic ice minimum has not declined, but since 2007 looks like fluctuations around a plateau. By mid-September, all the peripheral seas have turned to water, and the residual ice shows up in a few places. The table below indicates where we can expect to find ice this September. Numbers are area units of Mkm2 (millions of square kilometers).

Quelle: Science Matters
Im November 2018 berichtete das Lawrence Livermore National Laboratory in einer Pressemitteilung darauf hin, dass das arktische Meereis auch von natürlichen Klimazyklen mitbeeinflusst wird:
Models show natural swings in the Earth’s climate contribute to Arctic sea ice loss
Arctic sea ice loss in the last 37 year is not due to humans alone.
New research by a Lawrence Livermore National Laboratory (LLNL) scientist and collaborators show that Arctic sea ice loss is enhanced by natural climate fluctuations such as El Niños and La Niñas. With manmade greenhouse gases on top of the natural climate variability, the decrease in sea ice is even more severe than climate models originally estimated. Using a series of climate models, the team used a „fingerprint“ method to estimate the impact of natural climate variability. Natural swings in the Earth’s climate contribute to about 40 percent to 50 percent of the observed multi-decadal decline in Arctic sea ice.
„Internal variability can enhance or mute changes in climate due to greenhouse gas emissions. In this case, internal variability has tended to enhance Arctic sea ice loss,“ said Stephen Po-Chedley, an LLNL climate scientist and a co-author on a paper appearing in the Nov. 5 edition of Nature Geoscience. As it turns out, observations of sea ice loss were larger than models predicted. Sea ice loss since 1979 has increased due to natural variability; observations show more Arctic sea ice loss than the climate models average.
„It is important to note that individual runs do show large changes in sea ice that are comparable to observed sea ice changes,“ Po-Chedley said. „In these simulations, like in the real world, Arctic sea ice loss was enhanced by natural climate variability. „When natural variability is taken into account, Arctic sea ice loss is quite similar across models and observations.“
According to NASA, the planet has been shedding sea ice at an average annual rate of 13,500 square miles (35,000 square kilometers) since 1979, the equivalent of losing an area of sea ice larger than the state of Maryland every year. Model simulations (or „runs“) exhibit a range of sea ice trends. Depending on the timing of natural fluctuations, individual model runs can exhibit greater or smaller-than-average loss. Similarly, both natural variability and greenhouse gas changes contribute to the observed sea ice loss. „This study helps to quantify the degree to which natural and anthropogenic factors contributed to Arctic sea ice loss over the last few decades,“ Po-Chedley said.
The team found that enhanced ridging over the Arctic Ocean promotes warming and moistening in the lower troposphere (the lowest layer of Earth’s atmosphere where nearly all weather conditions take place), which in turn, leads to accelerated sea ice loss. Arctic sea ice decline may be important to rainfall in California. Previous research has suggested that Arctic sea ice loss can exacerbate droughts over California.
Hier das dazugehörige Paper von Ding et al. 2018:
Fingerprints of internal drivers of Arctic sea ice loss in observations and model simulations
The relative contribution and physical drivers of internal variability in recent Arctic sea ice loss remain open questions, leaving up for debate whether global climate models used for climate projection lack sufficient sensitivity in the Arctic to climate forcing. Here, through analysis of large ensembles of fully coupled climate model simulations with historical radiative forcing, we present an important internal mechanism arising from low-frequency Arctic atmospheric variability in models that can cause substantial summer sea ice melting in addition to that due to anthropogenic forcing. This simulated internal variability shows a strong similarity to the observed Arctic atmospheric change in the past 37 years. Through a fingerprint pattern matching method, we estimate that this internal variability contributes to about 40–50% of observed multi-decadal decline in Arctic sea ice. Our study also suggests that global climate models may not actually underestimate sea ice sensitivities in the Arctic, but have trouble fully replicating an observed linkage between the Arctic and lower latitudes in recent decades. Further improvements in simulating the observed Arctic–global linkage are thus necessary before the Arctic’s sensitivity to global warming in models can be quantified with confidence.
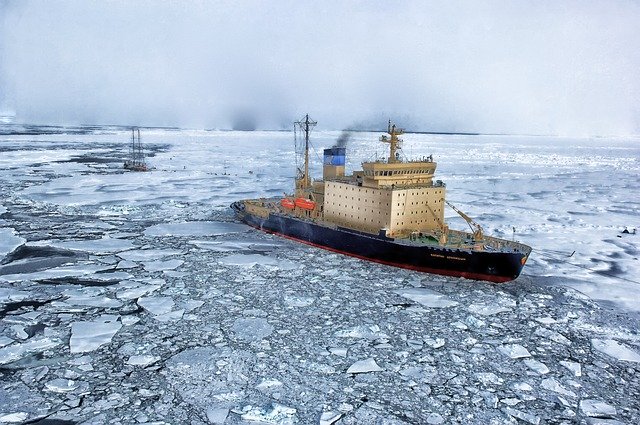
Die University of Washington (UW) in Seattle hat sich alte Schiffslogbücher vorgenommen und die arktische Meereisbedeckung der letzten 110 Jahre rekonstruiert. Da Satellitendaten erst seit 1979 zur Verfügung stehen, ist diese eine bedeutende Erweiterung der bisherigen Datensätze. Hier die Pressemitteilung der UW vom 8.8.2019:
More than 100 years of Arctic sea ice volume reconstructed with help from historic ships’ logbooks
Our knowledge of sea ice in the Arctic Ocean comes mostly through satellites, which since 1979 have imaged the dwindling extent of sea ice from above. The University of Washington’s Pan-Arctic Ice Ocean and Modeling System, or PIOMAS, is a leading tool for gauging the thickness of that ice. Until now that system has gone back only as far as 1979. A new paper now extends the estimate of Arctic sea ice volume back more than a century, to 1901. To do so it used both modern-day computer simulations and historic observations, some written by hand in the early 1900s aboard precursors to today’s U.S. Coast Guard ships.
„This extends the record of sea ice thickness variability from 40 years to 110 years, which allows us to put more recent variability and ice loss in perspective,“ said Axel Schweiger, a sea ice scientist at the UW’s Applied Physics Laboratory and first author of the study published in the August issue of the Journal of Climate. „The volume of sea ice in the Arctic Ocean today and the current rate of loss are unprecedented in the 110-year record,“ he added.
PIOMAS provides a daily reconstruction of what’s happening to the total volume of sea ice across the Arctic Ocean. It combines weather records and satellite images of ice coverage to compute ice volume. It then verifies its results against any existing thickness observations. For years after 1950, that might be fixed instruments, direct measurements or submarines that cruise below the ice.
During the early 20th century, the rare direct observations of sea ice were done by U.S. Revenue cutters, the precursor to the Coast Guard, and Navy ships that have cruised through the Arctic each year since 1879. In the Old Weather project, the UW, the National Oceanic and Atmospheric Administration and the National Archives have been working with citizen scientists to transcribe the weather entries in digitized historic U.S. ships‘ logbooks to recover unique climate records for science. The new study is the first to use the logbooks‘ observations of sea ice.
„In the logbooks, officers always describe the operating conditions that they were in, providing hourly observations of the sea ice at that time and place,“ said co-author Kevin Wood, a researcher at the Joint Institute for the Study of the Atmosphere and Ocean. If the ship was in open water, the logbook might read „steaming full ahead“ or „underway.“ When the ship encountered ice, officers might write „steering various courses and speeds“ meaning the ship was sailing through a field of ice floes. When they found themselves trapped in the ice pack, the log might read „beset.“
These logbooks until recently could only be viewed at the National Archives in Washington, D.C., but through digital imaging and transcription by Old Weather citizen-scientists these rare observations of weather and sea ice conditions in the Arctic in the late 1800s and early 1900s have been made available to scientists and the public. „These are unique historic observations that can help us to understand the rapid changes that are taking place in the Arctic today,“ Wood said.
Wood leads the U.S. portion of the Old Weather project, which originated in 2010 in the U.K. The weather observations from historic logbooks transcribed by Old Weather citizen scientists have already been added to international databases of climate data and were used in the model of the atmosphere that produced the new results. Officers recorded the ship’s position at noon each day using a sextant. They would also note when they passed recognizable features, allowing researchers today to fully reconstruct the ship’s route to locate it in space and time.
While the historic sea ice observations have not yet been incorporated directly into the ice model, spot checks between the model and the early observations confirm the validity of the tool. „This is independent verification that the model is doing the right thing,“ Schweiger said. The new, longer record provides more context for big storms or other unusual events and a new way to study the Arctic Ocean sea ice system.
„The observations that we have for sea ice thickness and variability are so limited,“ Schweiger said. „I think people will start analyzing this record. There’s a host of questions that people can ask to help understand Arctic sea ice and predict is future.“ The PIOMAS tool is widely used by scientists to monitor the current state of Arctic sea ice. The area of Arctic sea ice over the month of June 2019, and the PIOMAS-calculated volume, were the second-lowest for that time of year since the satellite record began.
The lowest-ever recorded Arctic sea ice area and volume occurred in September 2012. And while Schweiger believes the long-term trend will be downward, he’s not placing bets on this year setting a new record. „The state of the sea ice right now is set up for new lows, but whether it will happen or not depends on the weather over the next two months,“ Schweiger said. The other co-author is Jinlun Zhang at the UW Applied Physics Laboratory. The research was funded by the National Science Foundation, NASA, and the North Pacific Research Board.
Es ist ja bereits bekannt, dass das arktische Meereis während der letzten 100 Jahre langfristig abgenommen hat. Gerne hätte man aber doch etwas über mögliche Schwankungen des Meereises im Maßstab von Jahrzehnten gehört. Dazu sagt die Pressemitteilung leider nichts. Wir schauen uns daher den Abstract des betreffenden Papers von Schweiger et al. 2019 an. In der Kurzfassung tauchen die Schiffslogbücher leider explizit gar nicht auf. Dafür finden wir dort genau die Trendinformationen die wiederum in der Pressemitteilung fehlen. Das ist schon verrückt. Der Öffentlichkeit wollte man offenbar nicht zumuten, dass das arktische Meereis in der Zeit von 1940-1980 deutlich zunahm (siehe Abbildung unten). In der Zeit 1900-1940 schrumpfte das Meereis, allerdings nur im atlantischen Sektor, nicht hingegen im pazifischen Teil. Das unterscheidet die Schmelzphase von der modernen (viel stärkeren) Schmelze, da heute das Meereis sowohl im pazifischen als auch atlantischen Sektor schrumpft. Hier der Abstract von Schweiger et al. 2019:
Arctic Sea Ice Volume Variability over 1901–2010: A Model-Based Reconstruction
PIOMAS-20C, an Arctic sea ice reconstruction for 1901–2010, is produced by forcing the Pan-Arctic Ice Ocean Modeling and Assimilation System (PIOMAS) with ERA-20C atmospheric data. ERA-20C performance over Arctic sea ice is assessed by comparisons with measurements and data from other reanalyses. ERA-20C performs similarly with respect to the annual cycle of downwelling radiation, air temperature, and wind speed compared to reanalyses with more extensive data assimilation such as ERA-Interim and MERRA. PIOMAS-20C sea ice thickness and volume are then compared with in situ and aircraft remote sensing observations for the period of ~1950–2010. Error statistics are similar to those for PIOMAS. We compare the magnitude and patterns of sea ice variability between the first half of the twentieth century (1901–40) and the more recent period (1980–2010), both marked by sea ice decline in the Arctic. The first period contains the so-called early-twentieth-century warming (ETCW; ~1920–40) during which the Atlantic sector saw a significant decline in sea ice volume, but the Pacific sector did not. The sea ice decline over the 1979–2010 period is pan-Arctic and 6 times larger than the net decline during the 1901–40 period. Sea ice volume trends reconstructed solely from surface temperature anomalies are smaller than PIOMAS-20C, suggesting that mechanisms other than warming, such as changes in ice motion and deformation, played a significant role in determining sea ice volume trends during both periods.
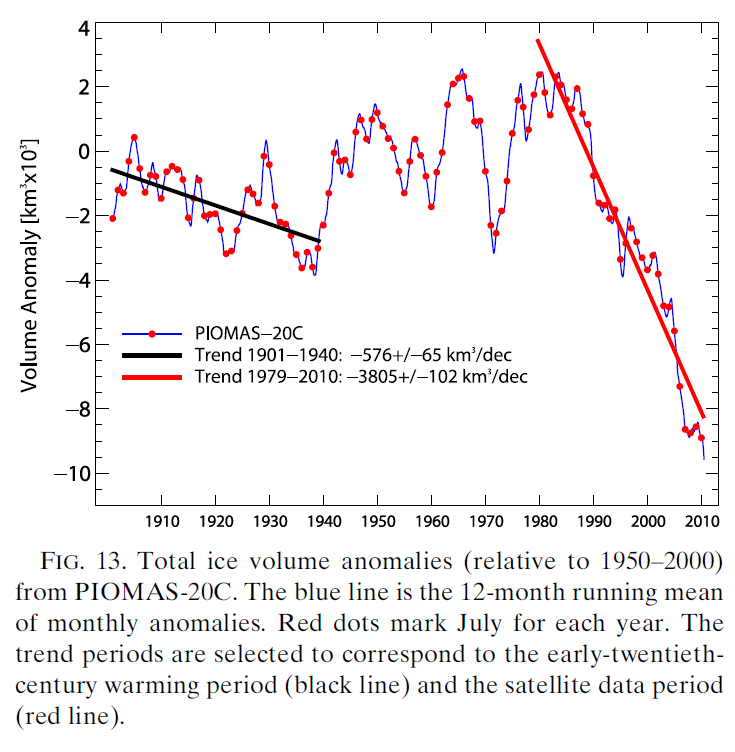
Abbildung: Entwicklung des arktischen Meereises während der letzten 110 Jahre. Quelle: Schweiger et al. 2019.
Stöbertip: Jeremy Bowman zeigt auf Hide the Decline alte Seekarten mit Informationen zu arktischen Meereisbedeckung.